
Good Ideas for City Hall Worth Sharing: Richmond Hill, Markham and Vaughan
City Hall Explained · By Yuliya Benedziktavich
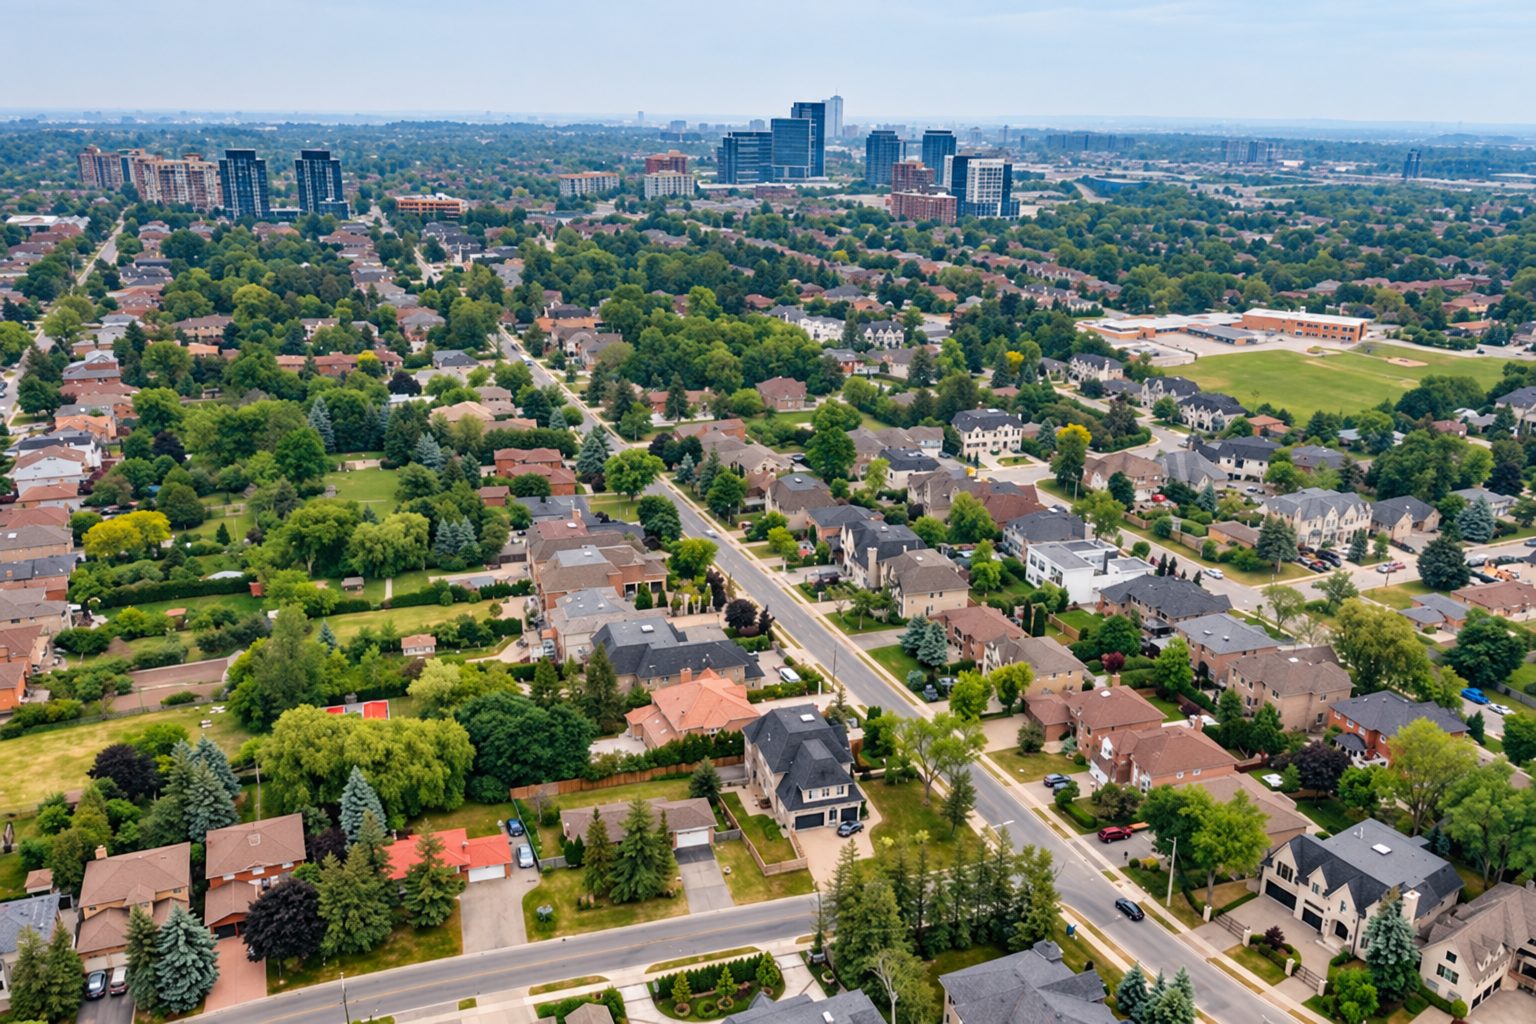
You finish work, buy groceries and go home to make dinner. There are bills to pay and tomorrow to plan. You want enough money for everyday needs, time for your family, and some peace of mind.
City services should help with that ordinary life. A problem gets a clear answer. A permit application does not leave you guessing. A safety check gets the attention it needs.
The City spends money on services. What do residents receive in return? Comparing Richmond Hill with Markham and Vaughan can help us ask better questions. The figures below explain the money involved. The examples and ideas show how it could make life easier.
The city spending and population figures are for 2025. The income and home-value figures come from the older Census and are dated separately. All amounts are Canadian dollars.
If you are waiting for help now, keep the request number, the date and the update you were given. Our guide to reporting a problem in Richmond Hill explains where to start. You can also read my priorities for Ward 5 or share an experience with me.
The essentials in a minute
What does this mean for my household?
Clear answers and fewer unnecessary trips can save time and reduce worry. City services should make everyday life easier.
Does all my property tax stay with the City?
No. In 2026, about $28 of every $100 stays with Richmond Hill. About $52 goes to York Region and $20 to education. Your own bill depends on your property’s assessed value and the tax rates.
Does Richmond Hill spend more than its neighbours?
In the 2025 financial reports, spending works out to about $1,636 per resident in Richmond Hill, $1,511 in Markham and $2,006 in Vaughan. These figures are not your tax bill and do not tell us which city provides better service.
Are there signs of improvement?
The City reports more Community Standards calls receiving a response within an hour. It also describes one fire-safety process shortened from 165 to 30 days. Those are useful examples, not a promise for every case.
What ideas could make life easier?
Let residents follow a request, make routine applications easier to complete, and show whether services deliver on time. See the examples from our neighbours and three improvements worth trying below.
What does feeling better off mean?
A person can live in an expensive house and still worry about the grocery bill. A pensioner may have owned the same home for decades. A renter pays for housing without owning a home at all.
For a household, a useful question is how much money remains after taxes and necessary expenses. These include housing, food, transport, medicines and childcare, where needed. What remains can help cover a surprise bill or build some savings.
Here is an invented example, not an estimate of Richmond Hill living costs. A household receives $6,000 a month after tax. It spends $3,200 on housing including utilities, $900 on food, $600 on transport and $800 on other necessary expenses. That leaves $500.
The City’s Census income report shows how different households can be. In 2020, about 11% had household income of $35,000 or less before tax. About 18.4% had more than $200,000. One middle figure cannot describe everyone.
The City does not set everyone’s wages or grocery prices. It can make its own services easier to use, reduce avoidable trips and explain what will happen next. That can give people back time and reduce worry.
Where does the City get its money?
The budget is the City’s plan for money coming in and money being spent. Property taxes are an important source, but they are not the only one.
- Property taxes. Homeowners and businesses pay taxes on their property. Only the local City share pays for local City services.
- Payments for services. These include water bills, building-permit fees and fees for some recreation programmes.
- Money from other governments. Ontario and the federal government provide money for certain services and projects. This is often called a grant.
- Payments connected with new development. Builders and developers contribute toward infrastructure and other needs created by growth. Some money must be used for particular purposes.
- Other income. This includes interest earned on money the City has invested, along with other fees and income.
For a large project, a city can also use money it has saved in earlier years or borrow money. Using savings is not new income. Borrowing must be repaid.
You can see these sources in the financial reports for Richmond Hill, Markham and Vaughan. Richmond Hill’s 2025 budget announcement says that more than 37% of its operating budget came from sources other than property taxes, such as fees and grants.
Not all the property tax collected stays with the City. The 2026 budget announcement puts the approximate shares at 28% for Richmond Hill, 52% for York Region and 20% for education. York Region pays for services such as regional police and transit. This matters when asking who is responsible for an improvement.
Where each $100 of property tax goes in 2026
Richmond Hill
28%
About $28 out of every $100. The local share helps pay for services such as local roads, parks, libraries and fire protection.
York Region
52%
About $52 out of every $100. The regional share helps pay for services such as police, transit and regional roads.
Education
20%
About $20 out of every $100 goes toward education.
These are the City’s approximate 2026 shares, shown as a $100 example. They are not a separate charge. The City explains how your property tax bill is calculated. The spending comparisons further down use the 2025 financial reports.
Our neighbours have more residents and more land
Think about snow clearing. The number of people matters, but so does the distance between them. A larger area can mean longer routes.
These are York Region’s population estimates for the end of 2025. The land areas use the same Statistics Canada table for all three cities. A square kilometre is an area one kilometre long and one kilometre wide.
Richmond Hill
223,541 residents
Land area of 100.79 km².
About 2,218 residents for each square kilometre.
Markham
367,721 residents
Land area of 210.93 km².
About 1,743 residents for each square kilometre.
Vaughan
366,176 residents
Land area of 272.44 km².
About 1,344 residents for each square kilometre.
We divided the population by the land area to get the last figure in each card. It gives a broad picture of how closely people live together. It includes undeveloped land, so it does not describe every neighbourhood.
Richmond Hill has the smallest area and the most residents per square kilometre of these three cities. That does not, by itself, tell us which city delivers better services.
Why two budget headlines can mean different things
Imagine comparing one family’s grocery bill with another family’s groceries, mortgage and car payment added together. The totals would not answer the same question.
City budget figures can have the same problem. An operating budget plans the cost of running services during the year. A capital budget plans spending on things that last for years, such as a road, a water pipe or a community centre.
| City | 2025 operating figure | What it includes |
|---|---|---|
| Richmond Hill | $245 million | Operating budget. Water, wastewater and stormwater have separate budgets. |
| Markham | $296.2 million | City services. Waterworks and several building and planning services are listed separately. |
| Vaughan | $441.9 million | The full cost of services in its property tax-supported operating budget, before related income is deducted. |
These published figures cover different things. We should not use them to rank the cities. Markham also publishes a combined total of $675.2 million, including capital and separately listed services. That larger number cannot fairly be compared with Richmond Hill’s $245 million figure above.
For a more consistent comparison, the next cards use actual expenses recorded in each city’s financial report for the same year.
What does spending per resident mean?
“Per resident” simply means that we divided the total by the number of people living in the city. It helps us compare cities of different sizes.
These figures use 2025 expenses for the City and the local organisations included in its accounts, such as the library. They include water and wastewater services as reported. They do not add the separate costs of York Region or education.
Richmond Hill
$1,636 per resident
Recorded expenses of $365.653 million.
Markham
$1,511 per resident
Recorded expenses of $555.472 million.
Vaughan
$2,006 per resident
Recorded expenses of about $734.383 million.
For Richmond Hill, the calculation is $365,653,000 divided by 223,541 residents. That is about $1,636. We used the same calculation for the other two cities and rounded to the nearest dollar.
This is not the amount each resident pays in tax. The money comes from several sources. Businesses and visitors use City services too.
The totals include something called amortization. This means counting a part of the recorded cost of a long-lasting item each year it is used. For example, a community centre can serve people for many years. Its annual recorded cost is different from the cash paid to build it.
Richmond Hill falls between its two neighbours on this measure. A smaller amount does not prove a better service. We still need to know what work was done, what condition things are in, and how well people were served.
What if we divide the spending by land area?
Using the same expenses, the result is about $3.63 million per square kilometre in Richmond Hill, $2.63 million in Markham and $2.70 million in Vaughan. For Richmond Hill, we divided $365.653 million by 100.79 square kilometres.
Richmond Hill now has the highest figure of the three. The City has not suddenly become worse at its job. We have simply divided by something different.
This shows how much total expense is recorded across a given land area. It does not tell us what it costs to maintain a road. For road maintenance, we would need to compare the cost of looking after the same length of road to the same standard. A library or a permit office does not become twice as expensive just because a city has twice as much land.
Does expensive housing make a city rich?
A home’s value, a household’s income and the City’s money are three different things. Here is some older Census information that helps show the difference.
Median household income means the income in the middle. Imagine placing all households in order from the lowest income to the highest. The median is the middle point, with roughly half above it and half below. It is the household’s total income, not one person’s salary.
| City | Middle household income in 2020 | Average home value in 2021 |
|---|---|---|
| Richmond Hill | $102,000 | $1,344,000 |
| Markham | $104,000 | $1,208,000 |
| Vaughan | $124,000 | $1,282,000 |
The income figures are before tax and come from York Region’s Census income report. They describe 2020, not today’s earnings.
The home values are averages of what owners thought their homes were worth in the 2021 Census. They are not today’s sale prices or the values used for property tax. The figures come from the housing reports for Richmond Hill, Markham and Vaughan.
Richmond Hill had the highest average home value of these three, but the lowest middle household income. That helps explain why “expensive homes” and “everyone has plenty of money” are not the same thing.
For the City itself, another figure is called net financial assets. In simple terms, it is financial assets, such as cash, investments and money owed to the City, minus its financial liabilities, meaning amounts it owes. At the end of 2025, this was $352.650 million for Richmond Hill, $672.475 million for Markham and about $708.701 million for Vaughan. Divided by population, that is about $1,578, $1,829 and $1,935 per resident.
These balances come from the same three City financial reports linked above. They are not all spare cash that can be spent on a new project. Some money is tied to particular needs or future obligations.
This three-city comparison cannot establish that Richmond Hill is one of the richest cities in the GTA. To make that claim, we would first need to agree what “richest” means and examine the other cities too.
How do we know whether a service is doing a good job?
Spending less is useful only if people still receive the service they need. A cheap service that leaves everyone waiting may not be good value.
We can ask a few ordinary questions.
- What did each finished job cost? Divide the cost of that service by the number of similar jobs completed.
- How long did people wait? Show the middle waiting time and also the longer waits. A good average can hide people who waited much longer.
- Were promised dates met? Count the jobs finished on time out of all the jobs due.
- Was the work done properly? Count errors, jobs that had to be reopened, and requests still waiting for attention.
The same words must mean the same thing in each city. A reply saying “we received your message” is different from solving the problem. Time waiting for the resident to send a missing document should be shown separately from time waiting for City staff to act.
You made the call. Now you are waiting
Imagine reporting a concern about a neglected property. You have explained the problem and gone back to your day. A prompt reply helps you know that someone has picked it up.
Richmond Hill’s 2025 progress report, on page 20 says that Community Standards responded to 73% of calls within an hour in 2024. In the first half of 2025, that rose to 81.5%.
More prompt replies
73% → 81.5%
The share of Community Standards calls receiving a response within an hour.
The periods are 2024 and the first half of 2025.
Fewer calls waiting longer
About 31% lower
The share waiting more than an hour fell from 27% to 18.5%.
This concerns the first reply, not a completed solution.
Here is the calculation. If 73% received a reply within an hour, 27% did not. Later, if 81.5% received a reply, 18.5% did not. The fall is 8.5 out of the original 27. Dividing 8.5 by 27 gives about 31%.
That is encouraging. It does not prove why the improvement happened. The comparison uses a whole year and half a year, and the types of calls may differ. The next question is whether the problem was resolved and the resident heard back.
A quicker process can help people reach safer conditions sooner
Imagine helping an older parent settle into a care home. You want to know that the building meets the fire-safety requirements that protect the people living there.
On page 20, the same Richmond Hill progress report describes work to reduce repeat fire inspections and the related paperwork. In that example, reaching the required fire-safety standard for building occupancy took 30 days instead of 165. Staff hours per occupancy fell by 40%.
Less time to meet the standard
135 days less
165 days minus 30 days is 135 days.
That is about four and a half 30-day months.
A shorter wait in this example
About 82% shorter
135 days divided by the original 165 days is about 82%.
This is one reported example, not the average for every inspection.
What does 40% less staff time mean? Suppose a similar job used to take 10 staff hours. A 40% reduction would bring it to 6 hours. Across 100 such jobs, that would leave 400 hours for other work.
The 10 hours and 100 jobs are invented to explain the percentage. The City reports the 40% reduction, but does not give those totals. Freeing time does not automatically mean the City paid out less money in wages.
This is a useful example already in our own city. The lesson is to remove repeated work while keeping the required safety checks. A faster process alone cannot tell us how many incidents were prevented.
Good examples we can learn from nearby
We do not have to begin every improvement from scratch. Here are three nearby examples, followed by what they could help us examine in Richmond Hill.
Vaughan
Follow a request
Service Vaughan lets residents track a request by its number. Signing in offers automatic updates. There is also a link to a map of service requests.
What to learn. Make it easy to see what happened after a report was sent, without another call.
Markham
See the next step
Markham’s building-permit page shows three stages. Plan the project, make an application, then arrange construction and inspections. It links to the online application system and related services.
What to learn. Give a first-time applicant a clear path through the work.
Markham
Show actual results
Its 2025 service report card gives a middle time of 9 working days to review a complete application and issue a permit in its houses category.
What to learn. Tell residents what a service achieved, as well as what it cost.
The nine-day figure applies to Markham’s category of houses not exceeding three storeys or 600 square metres. The report is marked unaudited, meaning the figures in that report card were not independently checked by an auditor. The time starts with a complete application. It is not the whole time from a person’s first enquiry, and it is not a promise that every permit will take nine days.
Richmond Hill already has an online customer service portal. It also accepts online building-permit applications and checks whether the required documents are included. That early check is called pre-screening.
So the question is how easy these existing services are for residents to use. Can someone find their request, understand what is missing and know what happens next? If residents struggle with a step, we can look at how a neighbour presents it and test a clearer approach. These examples do not prove that another city is better at everything.
Three improvements worth trying
A small trial can show whether an idea helps before the City pays to use it more widely. Start with one service, record how it works now, and compare what happens after the change. Include the cost of setting up and running it.
A clear update, without another phone call
Test one common type of service request with residents. Show the request number, the stage it has reached, what will happen next and when an update is expected. Improve the existing system where possible. Keep telephone help available.
Check whether residents understand the update, whether fewer people need to call again, and whether problems are finished sooner. Ask about the time people actually saved. For example, avoiding two unnecessary 45-minute trips would give someone back an hour and a half. That is an illustration, not measured savings.
Paperwork that is easier to get right
Richmond Hill already has instructions and an early document check for permits. Choose one routine type of application and ask first-time applicants to try following the existing submission instructions. Find the points where they get stuck.
Make those steps clearer. Show missing items together and explain what the applicant needs to do next. Markham’s step-by-step presentation is one example to examine.
Count how often documents are missing, how often an application is returned, how long people wait, and whether checks still catch the problems they should. The aim is less repeated work and more certainty, while keeping the same safety requirements.
A simple explanation of what our money buys
Alongside the budget, publish a short explanation of a few services people use often. Show the cost, the number of jobs completed, how long people waited and what still needs attention. Markham’s service report card is an example of showing results. Richmond Hill could build on its own existing reports and bring the cost and results together more clearly.
If the cost went up, explain why. Was more work done? Did an old building need repair? Did people receive a better service? Residents should not have to guess.
Check whether people can find and understand the explanation, and what it costs staff to prepare it. The point is useful information, not more paperwork for its own sake.
Keep the resident’s day in view
A useful improvement should make an ordinary day easier. It might mean fewer calls, a clearer answer, a safer place to live or more confidence about the next step.
I would want a proposal to explain what problem it solves, what it will cost to introduce and keep running, and how residents will know whether it worked. A large budget or a new piece of technology is not enough on its own.
If you are waiting for help now, keep the request number, the date and the update you were given. Our guide to reporting a problem in Richmond Hill explains where to start. You can also read my priorities for Ward 5 or share an experience with me.
What a good councillor would ask for
A good councillor would not ask for more paperwork. They would ask how the City can answer faster while using public money wisely.
- Make online tools easy to use. Online forms, request tracking and automatic updates show residents where their request is and what happens next. Richmond Hill already offers some of these, so the question is how simple they are to use.
- Let technology do the repeat work. Software can sort requests, check that documents are complete and send reminders, so staff have more time for cases that need a person. AI tools may help here, but only after careful testing, with residents’ privacy protected and a real person and a phone line always available.
- Test small, then measure. Try a change on one service, compare the waiting time and cost before and after, and keep only what works.
- Share the results in plain words. Residents should be able to see what was tried, what it cost and whether it helped.
These are ideas to explore, not promises. Council has nine members, so any change needs the support of City staff and other councillors.
Sources below checked 23 October 2026. City expenses and population estimates are for 2025. Income is for 2020. Home values and land areas come from the 2021 Census. Our divisions and percentages use the published figures and are rounded. The household budget, staff-hour and travel examples are invented illustrations, clearly described in the text.
Sourses:
- Richmond Hill — 2025 budget announcement
- Markham — 2025 Budget, executive summary (operating and total budget figures)
- Vaughan — adopted 2025 budget announcement
- Richmond Hill — 2025 audited financial statements, statements pp.1–2
- Markham — 2025 Annual Report, pp.26–28
- Vaughan — 2025 audited financial statements, pp.2–4
- York Region — 2025 Community Report, pp.5–6, population estimates and responsibilities
- Statistics Canada — 2021 population and land-area comparison
- York Region — 2021 Census income report (2020 household incomes)
- Richmond Hill — 2021 Census housing report, pp.4–5
- Statistics Canada — Markham Census Profile, income and owner-estimated dwelling values
- Statistics Canada — Vaughan Census Profile, income and owner-estimated dwelling values
- Richmond Hill — Strategic Plan 2025 Annual Report, p.20
- Markham — online services and Track My Problem
- Vaughan — service request tracking and updates
- Richmond Hill — online customer service
- Richmond Hill — 2021 Census income report, pp.5–6
- Markham — building-permit journey and ePLAN links
- Markham — 2025 Performance Measures Report Card (unaudited), p.1
- Richmond Hill — existing online building permits and pre-screening
- Richmond Hill’s 2026 budget and property tax shares
- How Richmond Hill calculates your property tax bill
What do you think?
Which City service would make the biggest difference to your everyday life? Share a question, experience or idea privately.
The numbers in this article come from the public reports listed in Sources. The comparisons and conclusions are my own reading of those reports, not official information from the City. Rounding and different ways of counting can change a result. If you see a number differently, please tell me in the form below. If the published reports show a different figure, I will update the article.
Please include your name and email so the team can reply. Your message will not appear as a public comment.